

 Since 1984, CPNRD’s Nitrogen and Irrigation Management Demonstration Project has been among Nebraska’s longest-running agricultural demonstration projects. It has served as a model for similar educational efforts at the state and national levels. The project began following the Hall County Water Quality Special Project to demonstrate that practices which reduce nitrogen fertilizer leaching into groundwater can protect water quality while maintaining crop yields. Producers with varying soil types and growing conditions work with CPNRD and the University of Nebraska–Lincoln to evaluate best management practices for efficient nitrogen and irrigation management.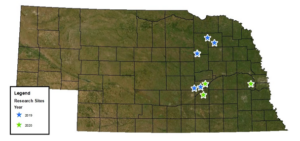
Sensor-Based Nitrogen Fertigation Project
In 2019 and 2020, growers participating in the Nebraska On-Farm Research Network experimented with using imagery to direct responsive nitrogen (N) application to corn through fertigation. The adoption of technology such as sensors mounted on an aerial platform may be used to improve nitrogen use efficiency (NUE) by responding to actual plant N need.
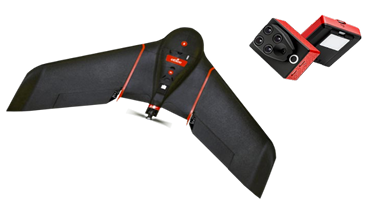
There were five sites in 2019 and 2020, one of which was repeated both years (Figure 1). Duplicate and close-proximity site locations are non-distinguishable. Managing Variability with Drone-based Sensors Nitrogen need varies spatially within a field and from year to year.
Study Design
The experiments were arranged in a randomized complete block design with four replications of three treatments. In 2019, treatments were the grower’s traditional N management, a risk-averse sensor-based fertigation approach, and a risk-tolerant fertigation approach (Figure 3).
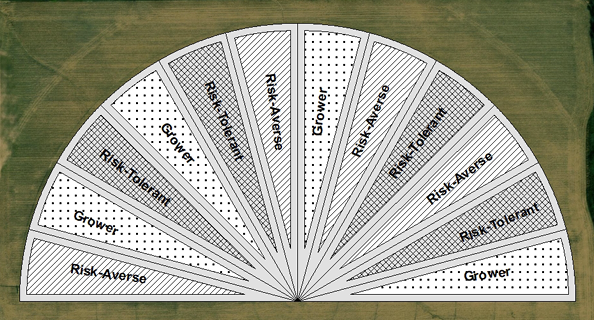
The risk-averse/risk tolerant approaches differed in the amount of indicated N deficiency required to trigger a fertigation application, with the risk-tolerant approach requiring more deficiency than the risk-averse approach to trigger an application. Risk-averse and risk-tolerant language was used to describe the two treatments, because risk-averse approach was designed to emphasize protecting yield potential over reducing applied N, whereas the risk-tolerant approach was designed to emphasize saving N over protecting yield potential.
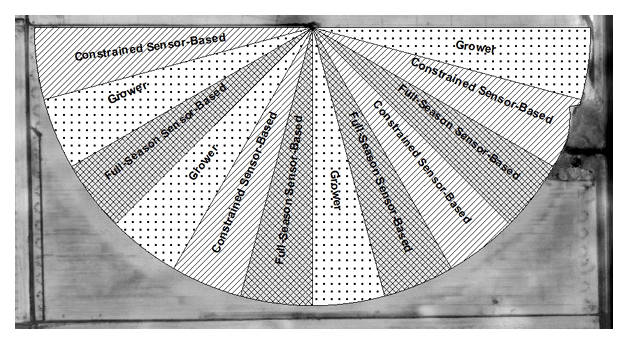
In 2020, treatments included the grower’s traditional N management, a constrained sensor-based management approach, and a full-season sensor-based management approach (Figure 4). The constrained sensor-based management approach followed the risk-averse approach from 2019, but was only implemented once the applied N for the season was within 60 lb/ac of the grower’s intended total applied N.
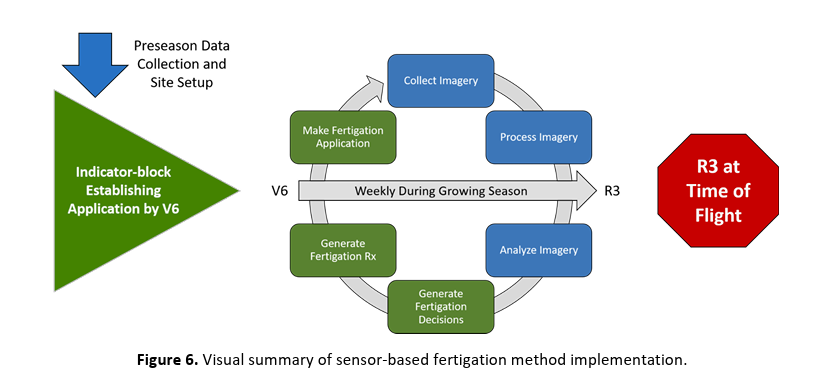
Full-season sensor-based management followed the risk-averse approach from 2019 for the entire growing season beginning at V6 or 10 days after indicator establishment, whichever was later. The treatments were applied in 15° sectors on half of a quarter section under pivot irrigation. By the V7 growth stage, indicator blocks were established in the field using traditional ground-based application equipment (e.g., high-clearance applicator) or via center pivot fertigation. Indicator blocks included at least two plots – an indicator plot and a reference plot – of two different N rates.
Indicator plots received 30 lb/ac less N than the bulk sector rate and reference plots received at least 30 lb/ac more N than the bulk sector rate. Four indicator blocks were established in each sector in 2019, while indicator blocks were established in each management zone represented in a sector in 2020.
Following indicator block establishment, each field site was flown weekly with the drone to collect multispectral imagery. Collected imagery was then analyzed, fertigation decisions were made for each treatment sector, and a fertigation prescription was generated. If indicator blocks in a given sector suggested that an N application was needed, fertigation was initiated at a rate of 30 lb N/ac.
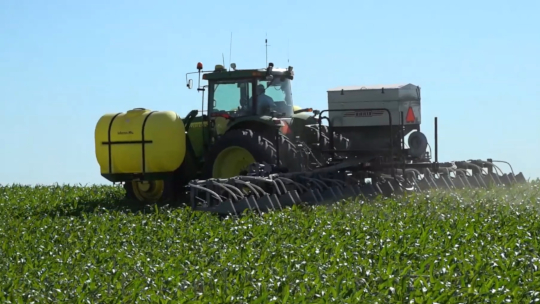
Only the sectors that indicated N application was needed received fertilizer; therefore, on a given fertigation date, it was possible for only one of the sectors in a given treatment to receive N, or for all four sectors of a given treatment to receive N. Each field site was equipped with a variable injection rate fertilizer pump on the center pivot system that injected liquid fertilizer into the irrigation water in order to fertigate the corn (Figure 5).
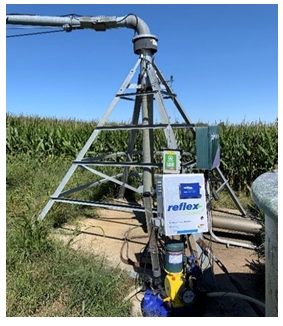
This allowed each sector to be managed independently using variable-rate fertigation applications. Fertigation applications were not allowed to occur in consecutive weeks to allow the crop enough time to Figure 5. Center pivot system equipped with a variable injection rate fertilizer pump. take up and incorporate applied nitrogen and therefore reduce the risk of excess fertilizer applications. Fertigation applications were allowed to occur up to the R3 growth stage as observed at the time of flight. The grower management was determined by the grower.
Ultimately, this method sought to improve fertigation application timing and make only necessary fertigation applications. Successfully accomplishing this goal would match applied N to the N uptake dynamics of corn and reduce the total N applied when possible, optimizing N management. A visual summary of method implementation is given in Figure 6 below.
Data Analysis
Yield for the plots was recorded with calibrated yield monitors. Following harvest, yield data were postprocessed using the USDA Yield Editor software (USDA) to remove erroneous data points, then the average yield from each sector was extracted. Yield from indicator plots was included in the analysis as they are a necessary element of this N fertilization method. Because the indicator plots occurred in all three treatments, they impacted yield equally. Statistical analysis and Tukey’s HSD mean separation were completed with R (R Core Team, 2019).
 Comprehensive Data
Data from all sites in 2019 and 2020 have been compiled and analyzed. Summary information is presented in this section. Primarily, sensor-based fertigation management treatments are compared versus typical grower management in terms of marginal net return (MNR, $/ac) and partial factor productivity (PFP, lb grain/lb N). Figure 6 shows distribution of all sites’ partial factor productivity differences versus the marginal net return differences compared with typical grower management at that site.
Values to the right of the y-axis indicate that the sensor-based management treatment was more efficient than typical grower management, whereas values left of the y-axis indicate that sensor-based management was less efficient than typical grower management. Similarly, points above the x-axis indicate that sensor-based fertigation management was more profitable than typical grower management, whereas points below the x-axis indicate that sensor-based fertigation management was less profitable than typical grower management. If sensor-based management was both more profitable and more efficient than typical grower management at a particular site, the point for that treatment at that site lies in the upper right-hand quadrant.
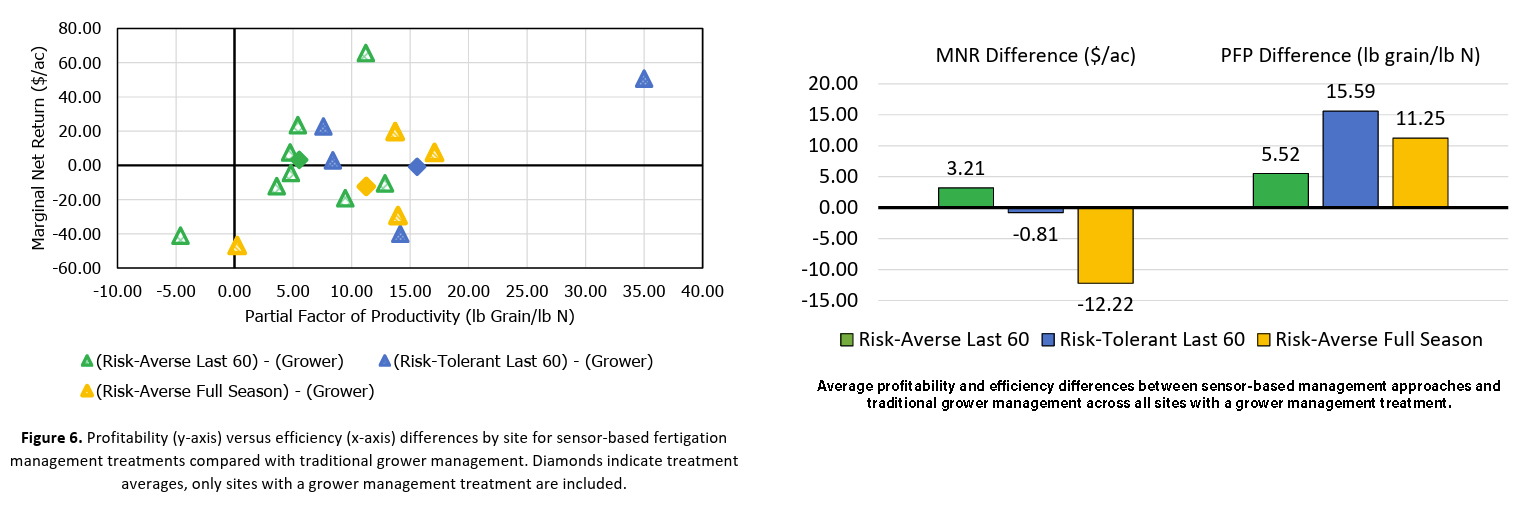
This distribution shows that approximately 94% of sensor-based fertigation treatment instances across all sites were more efficient than typical grower management. Only 53% of sensor-based fertigation treatment instances across sites were more profitable than typical grower management. On average, the risk-averse approach implemented for the last 60 lb/ac of intended applied N increased profitability by $3.21/ac versus typical grower management, while also increasing efficiency by 5.5 lb grain per lb of N applied.
All sensor-based fertigation management treatments improved efficiency on average, with the risk-tolerant approach implemented for the last 60 lb/ac of intended applied N realizing the most substantial gains at 15.6 lb grain/lb N. With only one year of data, the risk-averse approach implemented for the entire season appears to offer significant improvements in efficiency, but also appears to be very risky from a profit perspective with an average profit loss of $12.22/ac. This apparent profit risk is strongly influenced by two sites where profit losses were substantial, though the other two sites showed profit increases versus typical grower management.
Conclusions
A couple conclusions can be drawn from the comprehensive dataset compiled over the past two years. First, sensor-based fertigation management is likely to substantially improve NUE versus typical grower management if implemented. It is important to note that the efficiency improvements observed in these trials are relative to grower management strategies following recommended best management practices, such as multiple fertigation applications of small amounts throughout the growing season. Improvements in efficiency may be even more substantial compared with growers not following best practices. Second, implementing the risk-averse sensor-based management approach for only the last 60 lb/ac of intended applied N appears to offer the best combination of profitability and efficiency outcomes. Additional tuning of risk-averse implementation over the entire growing season and risktolerant implementation for the last 60 lb/ac of intended applied N may help to solve the profit inconsistency issue.
Continued Development
This study will continue in 2021 on as many as 6 sites, and plans are being made to continue into 2022. A software decision support tool automating the sensor-based fertigation management process is in the late stages of development and will be used to facilitate management on research sites beginning in the 2021 growing season. Additional agronomic analysis is being undertaken to determine the potential for adjusting fertigation application rates during critical application windows and extending the application window for sensor-based fertigation past the R2 growth stage. Future iterations of the project will continue to tune the approaches currently being implemented, integrate scalable imagery sources, and quantify nitrate losses. Updates regarding this research will be provided through UNL Extension media and at field days (restrictions permitting) in 2021.
Research Results
- 2019 - Howard County, NE
- 2019 - Merrick County, NE
- 2020 - Howard County, NE
- 2020 - Merrick County, NE
Your CPNRD Contact
Dean Krull
UNL/CPNRD Demonstration Project Coordinator
(402) 469-0155 | dkrull1@unl.edu